Code Interpreting with Groq and E2B in Python


This AI data analyst can plot a linear regression chart based on CSV data. It uses LLMs powered by Groq, and the Code Interpreter SDK by E2B for the code interpreting capabilities. The SDK quickly creates a secure cloud sandbox powered by Firecracker. Inside this sandbox is a running Jupyter server that the LLM can use.
Read more about models powered by Groq here.
The AI agent performs a data analysis task on an uploaded CSV file, executes the AI-generated code in the sandboxed environment by E2B, and returns a chart, saving it as a PNG file. The code is processing the data in the CSV file, cleaning the data, and performing the assigned analysis, which includes plotting a chart.
Key links
Outline
- Prerequisites
- Install the SDKs
- Set up the API keys and model instructions
- Add code interpreting capabilities and initialize the model
- Upload the dataset
Setup
1. Prerequisites
Create the main.ipynb file.
Get the E2B API key here and the Groq API key here.
If you want to use environment variables, copy the env.template file, and save it to a .gitignore file.
Download the CSV file from here and upload it to the same directory as your program. Name it data.csv.
2. Install the SDKs
pip install groq==0.6.0 e2b-code-interpreter==0.0.10 dotenv==1.0.03. Set up the API keys and model instructions
In this step you upload your E2B and Groq API keys to the program. In the JS & TS case, the API keys are stored in the .env file, in the Python case, they are added directly to the notebook. You pick the model of your choice by uncommenting it. There are some recommended models that are great at code generation, but you can add a different one from here.
The model is assigned a data scientist role and explained the uploaded CSV. You can choose different data but need to update the instructions accordingly.
import os
from dotenv import load_dotenv
import os
import json
import re
from groq import Groq
from e2b_code_interpreter import CodeInterpreter

load_dotenv()

# TODO: Get your Groq API key from https://console.groq.com/keys
GROQ_API_KEY = os.getenv("GROQ_API_KEY")

# TODO: Get your E2B API key from https://e2b.dev/docs
E2B_API_KEY = os.getenv("E2B_API_KEY")

# Choose from the codegen models:

MODEL_NAME = 'llama-3.1-70b-versatile'
# MODEL_NAME = 'llama-3.1-8b-instant'
# MODEL_NAME = 'llama3-groq-70b-8192-tool-use-preview'
# MODEL_NAME = 'llama3-groq-8b-8192-tool-use-preview'
# MODEL_NAME = 'llama3-70b-8192'
# MODEL_NAME = 'gemma2-9b-it'
# See the complete list of Groq models here: https://console.groq.com/docs/models.

SYSTEM_PROMPT = """You're a Python data scientist. You are given tasks to complete and you run Python code to solve them.

Information about the csv dataset:
- It's in the `/home/user/data.csv` file
- The CSV file is using , as the delimiter
- It has the following columns (examples included):
    - country: "Argentina", "Australia"
    - Region: "SouthAmerica", "Oceania"
    - Surface area (km2): for example, 2780400
    - Population in thousands (2017): for example, 44271
    - Population density (per km2, 2017): for example, 16.2
    - Sex ratio (m per 100 f, 2017): for example, 95.9
    - GDP: Gross domestic product (million current US$): for example, 632343
    - GDP growth rate (annual %, const. 2005 prices): for example, 2.4
    - GDP per capita (current US$): for example, 14564.5
    - Economy: Agriculture (% of GVA): for example, 10.0
    - Economy: Industry (% of GVA): for example, 28.1
    - Economy: Services and other activity (% of GVA): for example, 61.9
    - Employment: Agriculture (% of employed): for example, 4.8
    - Employment: Industry (% of employed): for example, 20.6
    - Employment: Services (% of employed): for example, 74.7
    - Unemployment (% of labour force): for example, 8.5
    - Employment: Female (% of employed): for example, 43.7
    - Employment: Male (% of employed): for example, 56.3
    - Labour force participation (female %): for example, 48.5
    - Labour force participation (male %): for example, 71.1
    - International trade: Imports (million US$): for example, 59253
    - International trade: Exports (million US$): for example, 57802
    - International trade: Balance (million US$): for example, -1451
    - Education: Government expenditure (% of GDP): for example, 5.3
    - Health: Total expenditure (% of GDP): for example, 8.1
    - Health: Government expenditure (% of total health expenditure): for example, 69.2
    - Health: Private expenditure (% of total health expenditure): for example, 30.8
    - Health: Out-of-pocket expenditure (% of total health expenditure): for example, 20.2
    - Health: External health expenditure (% of total health expenditure): for example, 0.2
    - Education: Primary gross enrollment ratio (f/m per 100 pop): for example, 111.5/107.6
    - Education: Secondary gross enrollment ratio (f/m per 100 pop): for example, 104.7/98.9
    - Education: Tertiary gross enrollment ratio (f/m per 100 pop): for example, 90.5/72.3
    - Education: Mean years of schooling (female): for example, 10.4
    - Education: Mean years of schooling (male): for example, 9.7
    - Urban population (% of total population): for example, 91.7
    - Population growth rate (annual %): for example, 0.9
    - Fertility rate (births per woman): for example, 2.3
    - Infant mortality rate (per 1,000 live births): for example, 8.9
    - Life expectancy at birth, female (years): for example, 79.7
    - Life expectancy at birth, male (years): for example, 72.9
    - Life expectancy at birth, total (years): for example, 76.4
    - Military expenditure (% of GDP): for example, 0.9
    - Population, female: for example, 22572521
    - Population, male: for example, 21472290
    - Tax revenue (% of GDP): for example, 11.0
    - Taxes on income, profits and capital gains (% of revenue): for example, 12.9
    - Urban population (% of total population): for example, 91.7

Generally, you follow these rules:
- ALWAYS FORMAT YOUR RESPONSE IN MARKDOWN
- ALWAYS RESPOND ONLY WITH CODE IN CODE BLOCK LIKE THIS:
``python
{code}
``
- the Python code runs in jupyter notebook.
- every time you generate Python, the code is executed in a separate cell. it's okay to make multiple calls to `execute_python`.
- display visualizations using matplotlib or any other visualization library directly in the notebook. don't worry about saving the visualizations to a file.
- you have access to the internet and can make api requests.
- you also have access to the filesystem and can read/write files.
- you can install any pip package (if it exists) if you need to be running `!pip install {package}`. The usual packages for data analysis are already preinstalled though.
- you can run any Python code you want, everything is running in a secure sandbox environment
"""
4. Add code interpreting capabilities and initialize the model
Now we define the function that will use the code interpreter by E2B. Everytime the LLM assistant decides that it needs to execute code, this function will be used. Read more about the Code Interpreter SDK here.
We also initialize the Groq client. The function for matching code blocks is important because we need to pick the right part of the output that contains the code produced by the LLM. The chat function takes care of the interaction with the LLM. It calls the E2B code interpreter anytime there is a code to be run.
def code_interpret(e2b_code_interpreter, code):
    print("Running code interpreter...")
    exec = e2b_code_interpreter.notebook.exec_cell(
        code,
        on_stderr=lambda stderr: print("[Code Interpreter]", stderr),
        on_stdout=lambda stdout: print("[Code Interpreter]", stdout),
        # You can also stream code execution results
        # on_result=...
    )

    if exec.error:
        print("[Code Interpreter ERROR]", exec.error)
    else:
        return exec.results

client = Groq(api_key=GROQ_API_KEY)

pattern = re.compile(
    r"```python\n(.*?)\n```", re.DOTALL
)  # Match everything in between ```python and ```


def match_code_blocks(llm_response):
    match = pattern.search(llm_response)
    if match:
        code = match.group(1)
        print(code)
        return code
    return ""


def chat_with_llm(e2b_code_interpreter, user_message):
    print(f"\n{'='*50}\nUser message: {user_message}\n{'='*50}")

    messages = [
        {"role": "system", "content": SYSTEM_PROMPT},
        {"role": "user", "content": user_message},
    ]

    response = client.chat.completions.create(
        model=MODEL_NAME,
        messages=messages,
    )

    response_message = response.choices[0].message
    python_code = match_code_blocks(response_message.content)
    if python_code != "":
        code_interpreter_results = code_interpret(e2b_code_interpreter, python_code)
        return code_interpreter_results
    else:
        print(f"Failed to match any Python code in model's response {response_message}")
        return []
5. Upload the dataset
The CSV data is uploaded programmatically, not via AI-generated code. The code interpreter by E2B runs inside the E2B sandbox. Read more about the file upload here.
def upload_dataset(code_interpreter):
    print("Uploading dataset to Code Interpreter sandbox...")
    dataset_path = "./data.csv"

    if not os.path.exists(dataset_path):
        raise FileNotFoundError("Dataset file not found")

    try:
        with open(dataset_path, "rb") as f:
            remote_path = code_interpreter.upload_file(f)

        if not remote_path:
            raise ValueError("Failed to upload dataset")

        print("Uploaded at", remote_path)
        return remote_path
    except Exception as error:
        print("Error during file upload:", error)
        raise error
6. Put everything together
Finally we put everything together and let the AI assistant upload the data, run an analysis, and generate a PNG file with a chart. You can update the task for the assistant in this step. If you decide to change the CSV file you are using, don't forget to update the prompt too.
with CodeInterpreter(api_key=E2B_API_KEY) as code_interpreter:
    # Upload the dataset to the code interpreter sandbox
    upload_dataset(code_interpreter)

    code_results = chat_with_llm(
        code_interpreter,
        "Make a chart showing linear regression of the relationship between GDP per capita and life expectancy from the data. Filter out any missing values or values in wrong format.",
    )
    if code_results:
        first_result = code_results[0]
    else:
        raise Exception("No code interpreter results")


# This will render the image
# You can also access the data directly
# first_result.png
# first_result.jpg
# first_result.pdf
# ...
first_result
7. Run the program and see the results
The file is generated within the notebook. The plot shows the linear regression of the relationship between GDP per capita and life expectancy from the CSV data.
Uploading dataset to Code Interpreter sandbox...
Uploaded at /home/user/data.csv

==================================================
User message: Make a chart showing linear regression of the relationship between GDP per capita and life expectancy from the data. Filter out any missing values or values in wrong format.
==================================================
import pandas as pd
import matplotlib.pyplot as plt
from sklearn.linear_model import LinearRegression
import numpy as np

# Load the data
data = pd.read_csv('/home/user/data.csv')

# Filter out missing values and values in wrong format
data = data[pd.notnull(data['GDP per capita (current US$)'])]
data = data[pd.notnull(data['Life expectancy at birth, total (years)'])]
data['GDP per capita (current US$)'] = pd.to_numeric(data['GDP per capita (current US$)'], errors='coerce')
data['Life expectancy at birth, total (years)'] = pd.to_numeric(data['Life expectancy at birth, total (years)'], errors='coerce')
data = data.dropna(subset=['GDP per capita (current US$)', 'Life expectancy at birth, total (years)'])

# Create a linear regression model
X = data[['GDP per capita (current US$)']]
y = data['Life expectancy at birth, total (years)']
...
plt.title('Linear Regression of GDP per capita vs Life expectancy')
plt.legend()
plt.show()
Running code interpreter...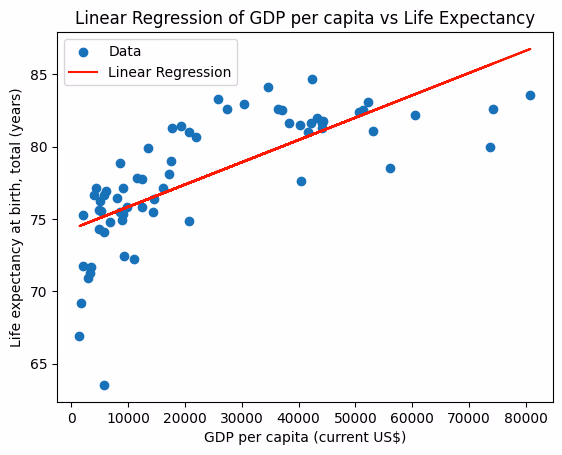
Resources
Secure AI Sandbox